Appearance
Products Reports
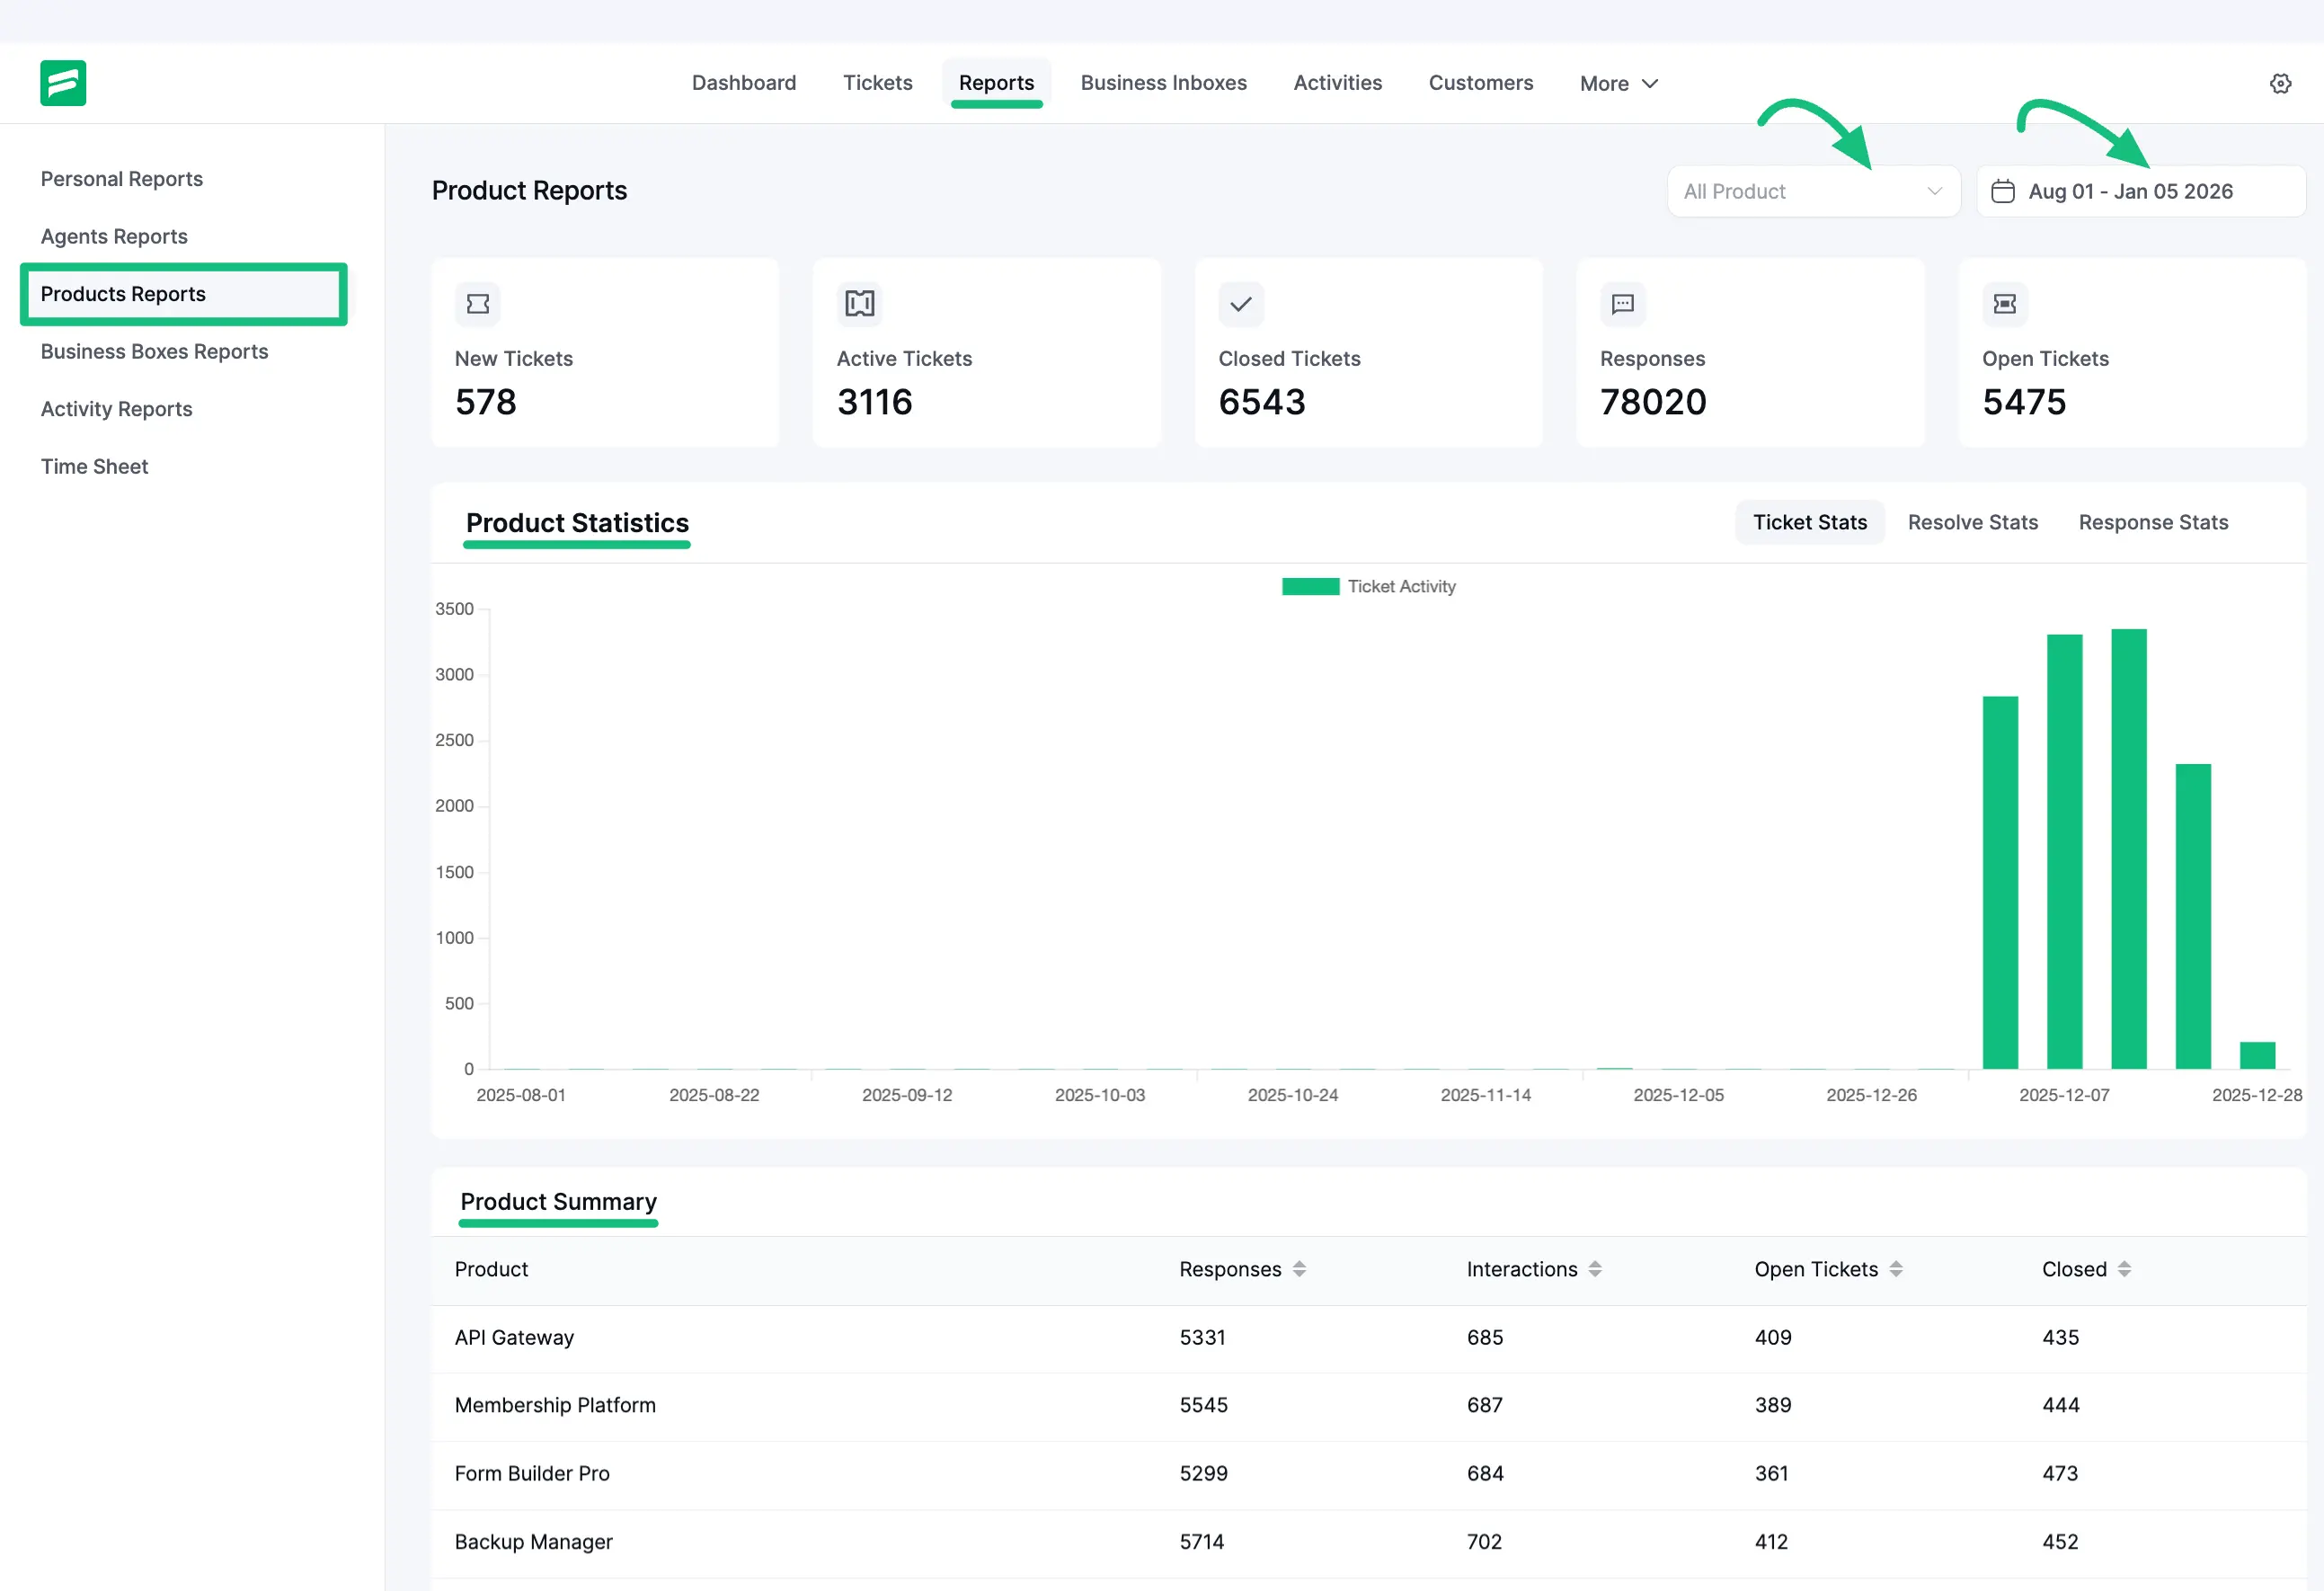
The ‘Products Reports’ section breaks down your support volume based on specific products. This is essential for understanding which products generate the most support requests.
Accessing Products Reports
To access products reports, go to the Reports tab from the top menu bar and select Products Reports from the left side.
Filtering and Statistics
- Product Filter: Use the dropdown menu to view statistics for All Products or select a specific product (e.g., FluentCRM, Fluent Form) to isolate its data.
- Product Statistics Graph: Shows the number of tickets for each product during the selected date range. You can also view Ticket Stats, Resolve Stats, and Response Stats.
Product Summary Table
The table at the bottom lists every product configured in your system. It displays:
- Responses: Number of replies sent for tickets related to this product.
- Interactions: Total touchpoints.
- Open Tickets: Current backlog for the product.
- Closed: Tickets for this product have been resolved.
This helps you identify which products might need better documentation or bug fixes based on high support volume.